The original idea of using Delaunay triangulation to generate a jump network came from Thomas Anderson, whose web page has been removed. However, you can see it at http://web.archive.org/web/20030626221505/http://users.ox.ac.uk/~univ0938/sc/freakazoid.html and http://web.archive.org/web/19991003022825/http://users.ox.ac.uk/~univ0938/sc/email.txt.
I am not a computational geometrician. I just use some of the techniques.
1. Jump lines
The Landis taxonomy of FTL drives (http://www.projectrho.com/stardrv.txt) includes several types which can only operate between pairs of fixed points. Whether this is a portal system with constructed jumpgates or an artifact of the universe, it means that there is a limited set of links between stars. How to build such a network in a plausible way? The approach given here is a good starting point, which works in two or three dimensions.
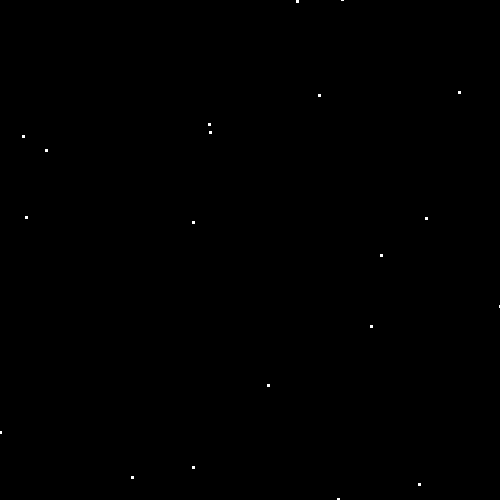
We start with a two-dimensional starmap containing 20 stars.
2. The Voronoi partition
The first conceptual stage is to construct a Voronoi partition of the starmap. This is a division of the map into regions around each star; a region is the set of points that are closer to that star than to any other. You don't actually need to do this if you just want the jump lines, but it may be of interest anyway;
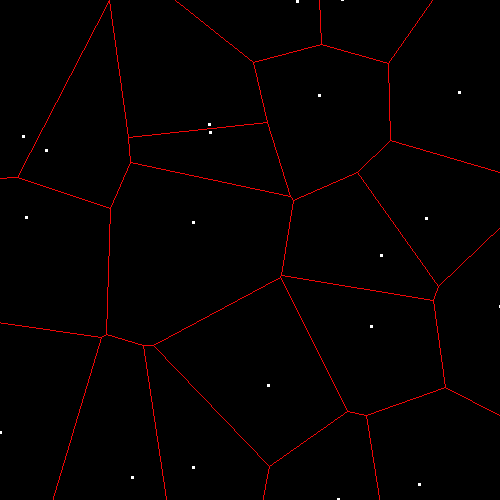
This in itself is not especially useful, though it might be interesting for astropolitics, and is a step on the road to:
3. The Delaunay triangulation
The triangulation breaks up the map into a series of triangles. This is the dual of the Voronoi partition: draw a line between each pair of stars that has a Voronoi edge between them, and you have the Delaunay triangulation.
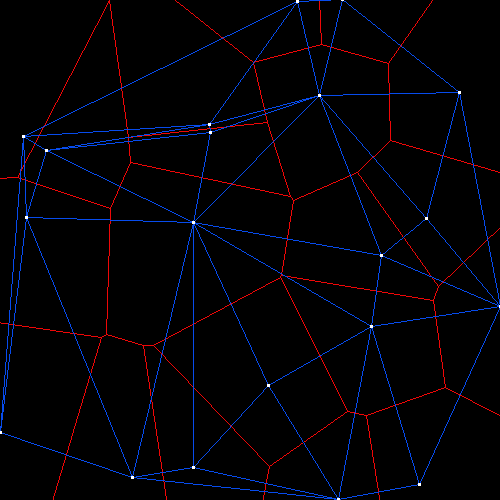
The Delaunay edges become the jump lines.
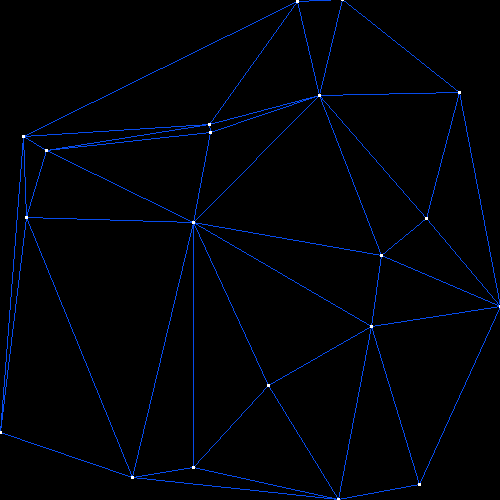
This is clearly a very well-connected map. It may be desirable to omit some of the routes, depending on the setting; but this system guarantees that every star is reachable from several others, so there are no dead ends. So far I have met two culling techniques that show some promise. Both of these should in theory still leave no stars entirely unreachable, though I have not formally verified this.
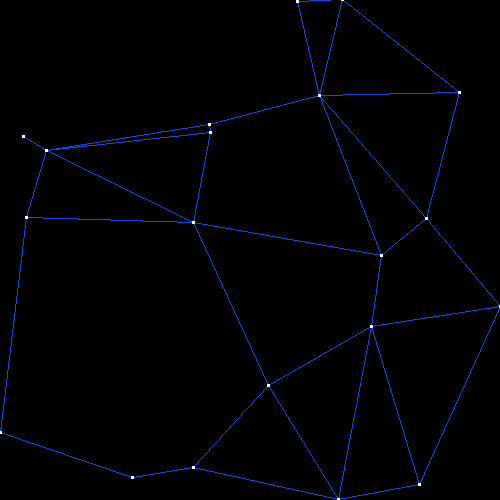
3.1. Region culling
(My own invention)
Delete every route that passes through a Voronoi region other than those of its endpoints. This is a fairly aggressive technique.
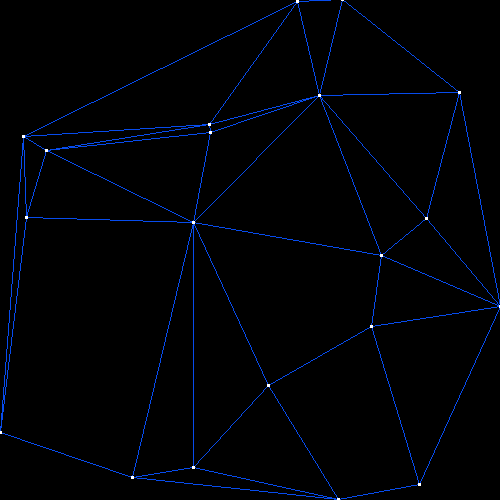
3.2. Length culling
(thanks to Sean Desmond)
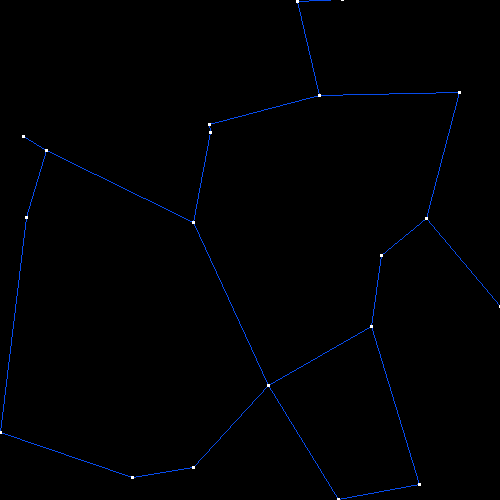
Mark the longest side of each Delaunay triangle. Delete every route that has two marks on it. This will generally have a fairly minor effect.
For a more extreme version, delete every route that has at least one mark on it.
4. Software
Any software that offers convex hull calculations should be able to perform these calculations. I use the qhull program from http://www.qhull.org/, since it is free and supplied with Debian GNU/Linux. I have also written some helper scripts in Perl (to convert data, and to handle edge culling) which are available here (voronoi_scripts.zip). These were used to produce the images shown above; their usage is described here.
For both programs, running them with the -h parameter will give a list of available options.
4.1. Linux/Unix
You will need Perl; you may also need to install the Text::CSV_XS and GD modules, and qhull itself. These are probably already packaged for the distribution you are using; under Debian GNU/Linux, for example,
# apt-get install libtext-csv-perl libgd-perl qhull-bin
4.2. Windows
You will first need to install ActiveState Perl. This is an 8.5 megabyte download; think of it as an equivalent to the Java Runtime Engine. It can be downloaded here: http://www.activestate.com/Products/Download/Download.plex?id=ActivePerl
Once you have it, you will need to install two extra modules. Bring up a command prompt and type:
> ppm3
ppm> install Text::CSV_XS
ppm> install GD
ppm> quit
You will also need to install qhull; there is a compiled version available at qhull.org. The qhull.exe binary should be placed in a directory on the path (the current directory will do).
Run the perl scripts from a command prompt, not by double-clicking on them.
4.3. partition.pl
partition.pl invokes qhull to perform the calculations. The only input file you need is a list of star coordinates; this must be supplied in comma-separated value format, with the first line being a list of field names. For example, this is the file used for the maps above:
x,y
-249.9960868153685,-184.2311058977909
127.8026612734447,-20.67493393148755
16.38361883012915,-140.5204067849744
-226.4776918818035,89.43235859221998
89.64820307646711,217.346448188039
-58.24896116577924,9.708186154913331
165.482673249657,-232.7139447282198
-223.2691824652899,14.85009679091172
85.57469219488529,-246.1509068926339
-58.29217453328164,-216.5788812251565
-41.25701267389303,93.38635634014975
44.48832156554639,215.2182475805452
173.0834454513001,13.46438891577012
-204.0175545998081,76.95948130167972
-42.00032147765189,100.5952973855616
205.1604154567797,131.0990200201972
-118.7735031068078,-226.2677431351205
118.040942464062,-85.88288685854793
66.31928409106963,128.2052431518261
245.5186929977673,-67.33066455212483
You may add a "z" field for three-dimensional maps, and continue with "w", "a", etc., for higher dimensions. Any fields with multi-letter names will be ignored; other software may take advantage of this to store names, star types, and other data. In the examples below, I assume this file is called coords.csv.
The "-s" parameter causes all fields to be scaled into the span 0-1; this may be useful in non-spatial situations where one scale is much larger or smaller than the others.
4.3.1. Voronoi partition
To calculate the Voronoi partition, run:
partition.pl -v verts -p polys coords.csv
"verts" and "polys" are the output files which will contain, respectively, Voronoi vertices and the polytopes they define. The first few lines of each file based on the sample data should be:
verts:
x,y
-10.101,-10.101
-2.238696908800447,1038.924391673682
-2.2386969088005,-1065.542988438099
-282.1256960763642,564.0567659016042
-898.444589025991,23.16437272345097
978.1916153974105,-14.40222935229744
-144.7087343610552,268.0352757684751
-956.3928726426352,-14.40222935229744
-919.1389171308157,6.936830845846225
polys:
18 8 7 16
41 30 32 31 38
28 22 24 26
14 4 3 6 12
37 19 20 35
42 33 13 17 25 24 26 30 41
29 9 10 27
18 8 4 14 13 17
29 9 2 15 23 22 28
25 23 22 24
This program cheats slightly; it adds a number of distant points to ensure that the Voronoi edges which leave the plotted area are still calculated correctly.
4.3.2. Delaunay triangulation
To calculate the Delaunay triangulation, run:
partition.pl -d delaunay coords.csv
"delaunay" is a file which will contain lists of vertices connected by the Delaunay triangulation, one group per line. The first ten lines of output from the sample data are:
7 3 0
17 6 19
6 17 8
14 11 3
13 14 3
13 7 5
7 13 3
16 9 5
16 7 0
7 16 5
4.3.3. Jump routes
To calculate jump routes on this basis, run:
partition.pl -r routes coords.csv
"routes" will contain a list of stars, one per line, followed by a list of connections from that star. The first ten lines of output from the sample data are:
0: 3 7 16
1: 5 12 17 18 19
2: 5 8 9 17
3: 0 7 11 13 14
4: 11 15 18
5: 1 2 7 9 10 13 16 17 18
6: 8 17 19
7: 0 3 5 13 16
8: 2 6 9 16 17
9: 2 5 8 16
Routes are given in both directions.
4.3.4. Culling routes
Both length-based and region-based culling are available. For region-based culling, just add "-n" to the parameter list; for length-based, add "-m N" (to mark the longest N edges - typically 1 for a two-dimensional map, 2 for three-dimensional) and "-l N" to cull the routes wiht N or more marks. The command lines for the three culled examples above would be:
partition.pl -r routes -n coords.csv
partition.pl -r routes -m 1 -l 2 coords.csv
partition.pl -r routes -m 1 -l 1 coords.csv
4.4. plot.pl
The plot program generates a PNG image of the star map. At a minimum, it must be given the star coordinates CSV file; if it is given Voronoi vertex/polytope data or jump routes, it will plot those as well.
Plotting does not yet work with three-dimensional maps, though I hope to add a coordinate projection system shortly. However, you can generate multiple views by using different axes ("-x z" will use the z data for the x axis of the plot, etc).
plot.pl -v verts -p polys -o map-voronoi.png coords.csv
plot.pl -v verts -p polys -r routes -o map-both.png coords.csv
plot.pl -r routes -o map-delaunay.png coords.csv
This is not by any means a perfect program.
4.5. showroute.pl
Given the coordinate file and a list of (numerical) routes, this program generates a text-based route list which is easier to read than the numerical version. It uses the "name" field in the coordinate file if it is present.
showroute.pl -r routes coords.csv
4.6. route2dot.pl
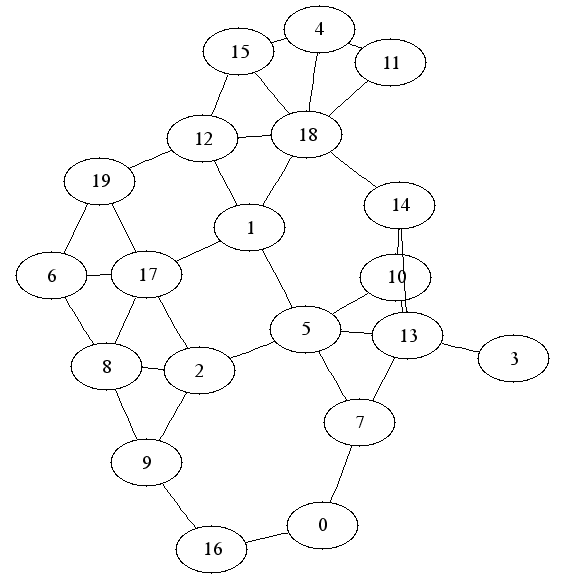
Given the coordinate file and a list of (numerical) routes, this program writes a dot file suitable for plotting with graphviz (http://www.graphviz.org/). As with showroute.pl, the "name" field in the coordinate file is used for labelling.
route2dot.pl -r routes -o routemap.dot coords.csv
neato -Tpng -o routemap.png routemap.dot
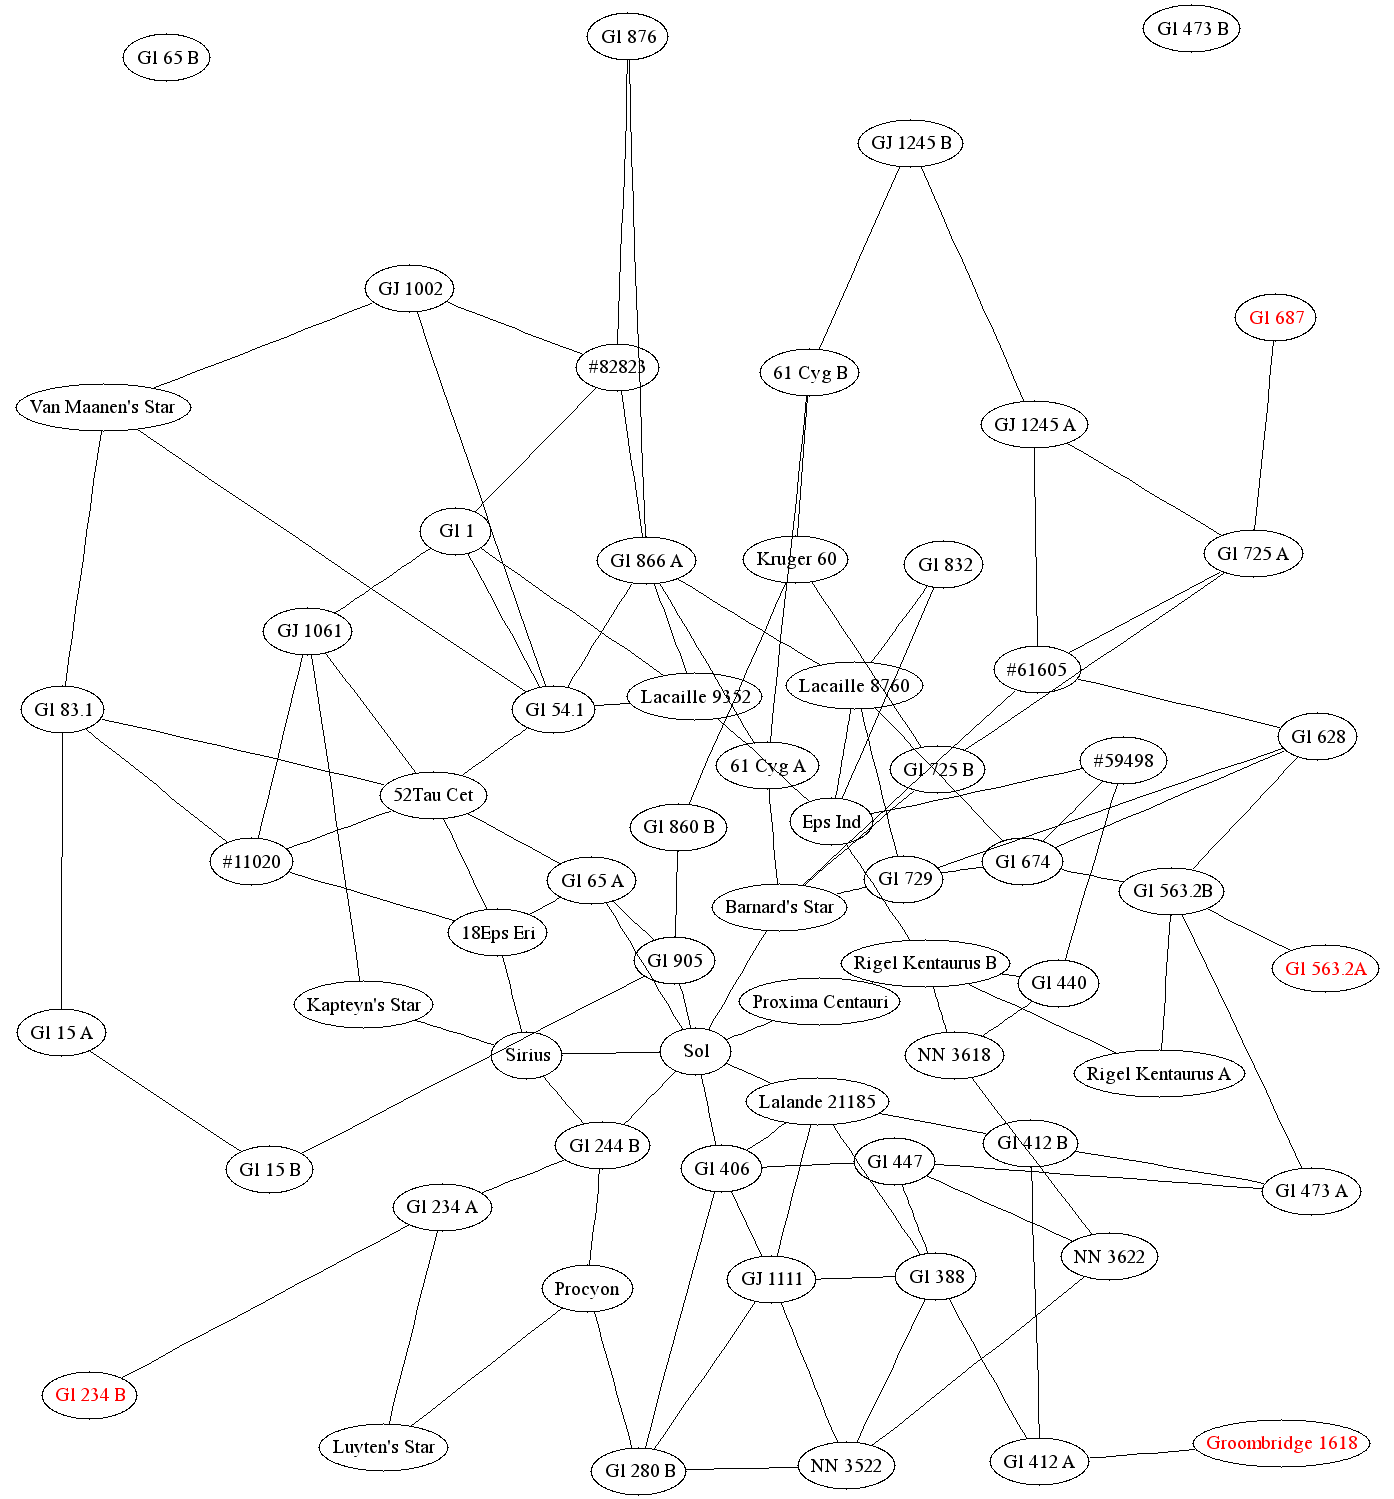
Using the route map generated with Voronoi region culling produces:
5. Near Stars
Using David Nash's composite stellar catalogue at http://astronexus.com/node/34, and selecting for stars within 5 parsecs of Sol to keep the numbers reasonable, produces a playable map. This is generated under a fairly substantial restriction, using both region culling and mark 2/cut 1 length culling ("-n -m 2 -l 1"), which seems a reasonable compromise between massive interconnection and leaving isolated islands of stars: